News Story
Social Distancing: Drop Seen for First Time Since Outbreak
 The COVID-19 outbreak is far from over—but some Americans are jumping the gun when it comes to easing up on social distancing, according to new data from the University of Maryland (UMD).
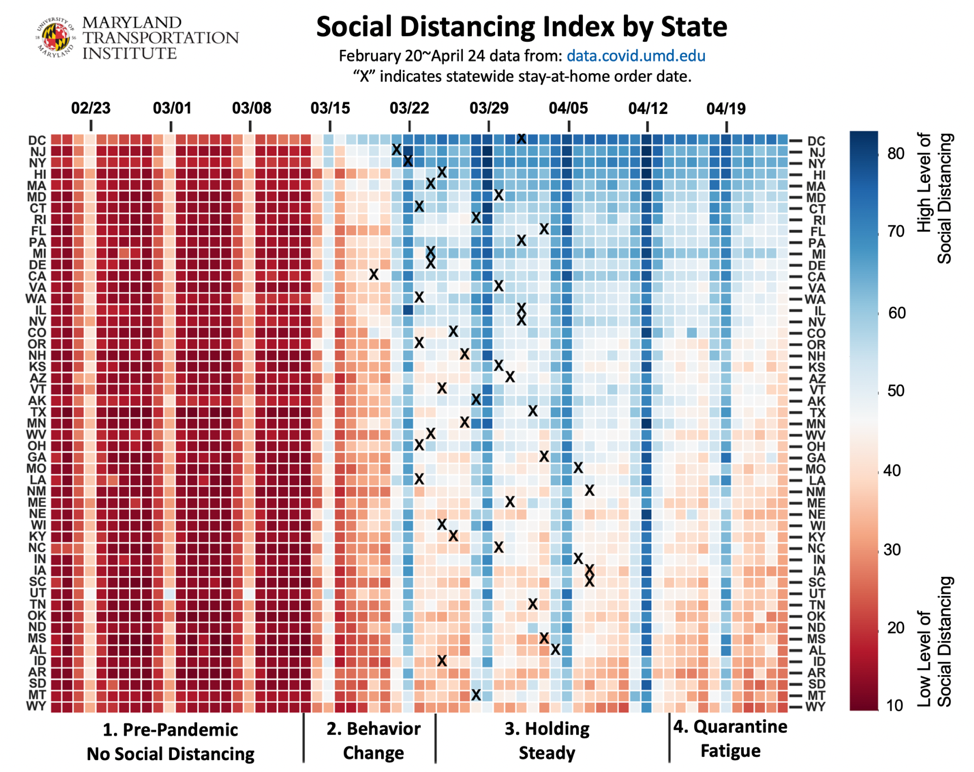
Researchers at the Maryland Transportation Institute (MTI), part of UMD’s A. James Clark School of Engineering, are reporting a decline in the Social Distancing Index (SDI), starting on April 14, 2020. The SDI is a metric that records compliance with restrictions and guidelines meant to contain the outbreak.
It is the first such decline to be recorded nationwide since the beginning of the COVID-19 pandemic outbreak in the U.S., and comes after successive weeks of the SDI either increasing or holding steady.
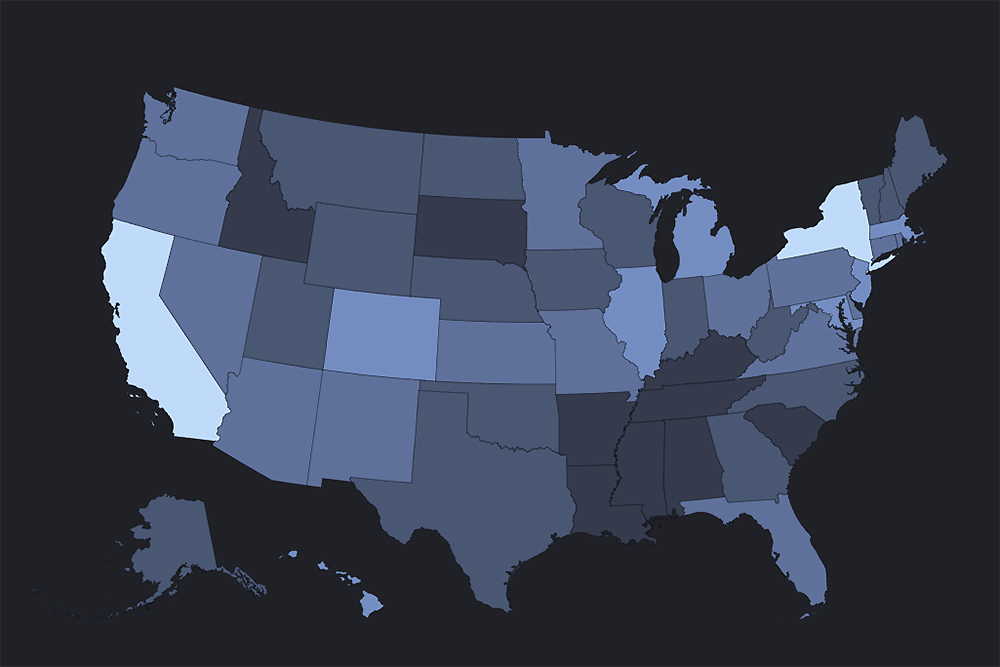
The trend is widespread: as of April 24, 2020, 48 states have seen a reduction in their SDI, with the largest drops seen in Louisiana (-15), Ohio (-13), Indiana (-12), Vermont (-12), Alabama (-11), Michigan (-11), Mississippi (-11), North Carolina (-11), and Texas (-11).
The SDI steadily increased in the United States from March 13 through April 13, rising from 14 to 51. On April 14, however, it began to decline. Week-on-week comparisons show a 3-point drop between April 11-17 and the previous week. And the trend has continued, with a further 4-point drop between April 18-24. Nationwide, the index now stands at 44.
The number of work trips has not changed, and the declining SDI is caused mostly by fewer people staying home, more non-work trips, more out-of-state and out-of-county trips, and longer travel distances, according to MTI.
The index is calculated daily by MTI, using anonymized and aggregated location-based service data from mobile phones and other sources. All results at the state and county levels are publicly available on an interactive COVID-19 impact analysis platform created by MTI in partnership with the Center for Advanced Transportation Technology (CATT) Laboratory.
The numbers reinforce concerns that warmer weather and public debate over reopening may be spurring a premature loosening of social distancing behavior, even as COVID-19 cases continue to mount.
“The real question is what we should do about this observed shift in social distancing momentum,” said Lei Zhang, Herbert Rabin Distinguished Professor and director of MTI, who leads the study. “To those who decided to loosen up and started going out for non-essential purposes, we need to more effectively communicate the importance of social distancing through customized messaging targeting different population groups.”
“To those who are hurt the most by the economic impact and eager to go back to work, governments may need to consider additional assistance especially if we ask them to stay at home for another month or longer.”
| State | 3/13/20 | 3/20/20 | 3/27/20 | 4/3/20 | 4/10/20 | 4/17/20 | 4/24/20 | SDI Change: 4/10~4/24 |
|---|---|---|---|---|---|---|---|---|
| LA | 12 | 35 | 45 | 45 | 50 | 41 | 35 | -15 |
| OH | 14 | 37 | 52 | 43 | 50 | 50 | 37 | -13 |
| IN | 13 | 29 | 48 | 39 | 44 | 47 | 32 | -12 |
| VT | 14 | 35 | 48 | 50 | 51 | 46 | 39 | -12 |
| AL | 11 | 29 | 30 | 31 | 38 | 32 | 27 | -11 |
| MI | 14 | 38 | 59 | 55 | 62 | 61 | 51 | -11 |
| MS | 11 | 28 | 31 | 33 | 38 | 32 | 27 | -11 |
| NC | 12 | 27 | 36 | 39 | 44 | 35 | 33 | -11 |
| TX | 13 | 35 | 45 | 49 | 48 | 44 | 37 | -11 |
| AK | 16 | 36 | 51 | 54 | 48 | 43 | 38 | -10 |
| ND | 13 | 33 | 35 | 48 | 38 | 34 | 28 | -10 |
| SC | 11 | 25 | 33 | 34 | 41 | 33 | 31 | -10 |
| TN | 12 | 30 | 34 | 37 | 40 | 32 | 30 | -10 |
| GA | 13 | 31 | 39 | 42 | 45 | 39 | 36 | -9 |
| KY | 13 | 31 | 39 | 36 | 42 | 40 | 33 | -9 |
| MN | 13 | 39 | 41 | 56 | 46 | 43 | 37 | -9 |
| NM | 13 | 27 | 44 | 39 | 44 | 38 | 35 | -9 |
| UT | 14 | 35 | 40 | 41 | 40 | 39 | 31 | -9 |
| WI | 12 | 36 | 46 | 44 | 43 | 40 | 34 | -9 |
| WV | 14 | 31 | 45 | 40 | 46 | 39 | 37 | -9 |
| CA | 16 | 47 | 53 | 51 | 57 | 52 | 49 | -8 |
| NV | 15 | 44 | 50 | 50 | 53 | 50 | 45 | -8 |
| MT | 15 | 26 | 28 | 41 | 31 | 29 | 24 | -7 |
| OK | 13 | 27 | 36 | 44 | 36 | 35 | 29 | -7 |
| AZ | 15 | 30 | 42 | 45 | 45 | 43 | 39 | -6 |
| HI | 14 | 36 | 61 | 62 | 66 | 63 | 60 | -6 |
| IL | 14 | 37 | 53 | 48 | 51 | 54 | 45 | -6 |
| ME | 15 | 35 | 39 | 50 | 40 | 36 | 34 | -6 |
| NH | 13 | 33 | 39 | 51 | 48 | 43 | 42 | -6 |
| PA | 15 | 42 | 51 | 53 | 57 | 52 | 51 | -6 |
| CO | 15 | 45 | 54 | 53 | 48 | 50 | 43 | -5 |
| DE | 15 | 33 | 46 | 49 | 54 | 48 | 49 | -5 |
| IA | 12 | 33 | 40 | 44 | 36 | 39 | 31 | -5 |
| ID | 14 | 23 | 41 | 37 | 32 | 31 | 27 | -5 |
| MO | 13 | 30 | 43 | 43 | 41 | 43 | 36 | -5 |
| NY | 20 | 51 | 64 | 68 | 70 | 65 | 65 | -5 |
| VA | 14 | 36 | 45 | 48 | 51 | 45 | 46 | -5 |
| WA | 20 | 36 | 57 | 52 | 50 | 48 | 45 | -5 |
| AR | 12 | 26 | 31 | 34 | 31 | 30 | 27 | -4 |
| DC | 23 | 59 | 67 | 70 | 73 | 69 | 69 | -4 |
| NE | 14 | 38 | 38 | 46 | 38 | 42 | 34 | -4 |
| SD | 13 | 29 | 33 | 44 | 29 | 31 | 25 | -4 |
| CT | 16 | 42 | 49 | 58 | 59 | 52 | 56 | -3 |
| KS | 14 | 33 | 43 | 52 | 44 | 44 | 41 | -3 |
| MD | 14 | 40 | 52 | 57 | 59 | 54 | 56 | -3 |
| NJ | 17 | 49 | 62 | 65 | 68 | 62 | 65 | -3 |
| FL | 13 | 34 | 49 | 53 | 54 | 50 | 52 | -2 |
| OR | 17 | 31 | 50 | 46 | 44 | 40 | 42 | -2 |
| MA | 18 | 45 | 57 | 64 | 60 | 56 | 60 | 0 |
| WY | 15 | 28 | 32 | 30 | 23 | 28 | 23 | 0 |
| RI | 16 | 39 | 45 | 56 | 51 | 48 | 54 | 3 |
| Nation | 14 | 38 | 48 | 50 | 51 | 48 | 44 | -7 |
Published April 28, 2020
Related Stories
Stories / August 3, 2023
Lex Schultheis Named a Winner of the NIOSH Respirator Fit...

Stories / April 13, 2022
Safe Storage

Stories / January 18, 2022
Gaining an Edge on Infectious Diseases

Stories / September 29, 2021
UMD Engineers Help Pioneer New Treatment for Respiratory Failure

Stories / April 30, 2021
Wall Street Journal Cites MTI Research
Stories / February 19, 2021
Working Together to Show COVID's Impact on Communities of Color
Stories / February 17, 2021
UMD Research Sheds Light on Holiday Travel and COVID
Stories / January 12, 2021
'Perfect adherence' to COVID vaccine prioritization hampering...

Stories / October 21, 2020
A Tech Rx for COVID Recovery at Home

Stories / September 21, 2020
Striking Up the Band Again—Safely